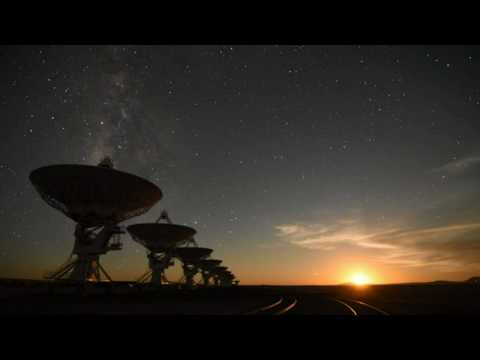
Saturday, 30 March 2019

Knowledge Discovery with WEKA

30/3/2019 Introduction to WEKA. The Waikato Environment for Knowledge Analysis

The hype for all this AI stuff is getting severely overblown. But that being said predictive algorithms will be an important tool for scientists in any field in the years to come.

Astronomy is no different.

Neural Networks have been used to classify pulsar candidates in this paper:

  • V. Morello, E. D. Barr, M. Bailes, C. M. Flynn, E. F. Keane: “SPINN: a straightforward machine learning solution to the pulsar candidate selection problem”, 2014; arXiv:1406.3627. DOI: 10.1093/mnras/stu1188.

Astronomy datasets are notorious for putting the BIG in BIG Data. Not only are the objects being studied are separated from Earth by large distances but also, the true nature of the signals that they produce are magnificently intense.

The paper states that it as the data mounts up in the future, it will no longer be feasible to process it using a typical 'human cogitator' i.e. Grad Students approach to vet the data. That's where the Data Mining and Machine Learning will comes in.

Twinkle Twinkle little Pulsar, But is that what you really are?


So i guess it is important for yours truly to get to grips with it. Thats where WEKA comes in.

WEKA is an an environment that can be used to analyze datasets using prebuilt data mining algorithms.

We can test the same data set with different data mining algorithms to take a measure of their performance. This is done by finding their percentage of correctly classified and their time taken to build model.

The following is a description of the Classifier/ Data Mining Algorithm/ Learner that we use to analyze the attributes/feature and put the data into class.

Data mining’s eclectic nature fostered this inconsistency in naming—the field encompasses contributions from statistics, artificial intelligence (Machine Learning),and database management;each field has chosen different names for the same concept. 

One-R (One Rule
Naive Bayes (probabilistic Classifier with strong independence assumption)
IBK (K Nearest Neighbour)
J48 (unpruned C4.5 decision tree)
Random Forest (Random Decision Forests)
MLP (Multi Layer Perceptron)
SMO (Support Vector Machines)

Data-set
Classifier
Percent correct (%)
Time to Construct (s)
Weather-nominal
One-R
42.8571
0.00

Naïve Bayes
57.1429
0.00

IBK
57.1429
0.00

J48
50.000
0.00

Random Forest
71.4286
0.02

MLP
71.4386
0.03

SMO
64.2857
0.01


Iris
One-R
92.0000
0.01

Naïve Bayes
96.0000
0.01

IBK
95.3333
0.00

J48
96.0000
00.0

Random Forest
95.3333
0.06

MLP
97.3333
0.14

SMO
96.0000
0.04


Pima Diabetes
One-R
65.1042
0.00

Naïve Bayes
76.3021
0.005

IBK
70.1823
0.00

J48 (with missing values)
73.8281
0.02
J48 (Remove Corrupt Instances)

J48 (Padded Corrupt Instances)
74.6228
74.0885
0.01


0.01

Random Forest
75.7813
0.18

MLP
75.3906
0.40

SMO
77.3438
0.03


Soybean
One-R
39.9707
0.01

Naïve Bayes
92.9722
0.01

IBK
91.215
0.00

J48
91.5081
0.04

Random Forest
92.9722
0.19

MLP
93.4114
20.00

SMO
93.8507
0.49

Repeating the model building resulted in faster build time but no changes in accuracy.

Support Vector Machine can be not bad

Thursday, 28 March 2019

Matlab DSP with Unit Sample and Unit Step Signal

28/3/2019 Digital Signal Processing Matlab

Seriously i have an assignment tomorrow but here I am doing this signal stuff. Like wtf Life.

Unit Sample and Unit Step Signals are the fundamentals of Signals Processing. Its the first thing you learn before you hit Cyclic Spectroscopy.

How do we generate this?

%Lab 1
%Generation of Unit Sample Sequence
clf;

%Begin
vectorLength = -10:20;
vectorLength2 = -10:7;
vectorLength3 = 1:20;
vectorLength4 = 1:7;

M = 13; %Delayed by M Samples
N = 20;

u = [zeros(1,10) 1 zeros(1,20)];
ud = [zeros(1,M) 1 zeros(1,N - M - 3)];

%Now do Unit Step
s = [ones(1,20)];

%Unit Step Depayed
sd = [ones(1,20 - M)];

%plot unit sample
figure(1)
stem(vectorLength, u)
xlabel('Time index n');
ylabel('Amplitude');
title('Unit Sample Sequence');
axis([-10 20 0 1.2]);

hold on

stem(vectorLength2, ud,'Color',[.204 .64 .100])

%Delayed Unit Sample
figure(2)
stem(vectorLength2, ud, 'Color',[.204 .64 .100])
xlabel('Time index n');
ylabel('Amplitude');
title('Unit Sample Delayed');
axis([-10 20 0 1.2]);

%Delayed Unit Sample
%Equivalence Principle
figure(3)
stem(vectorLength3, s)
xlabel('Time index n');
ylabel('Amplitude');
title('Unit Step Sequence');
axis([-10 20 0 1.2]);

%Delayed Unit Step
figure(4)
stem(vectorLength4, sd,  'Color',[.103 .62 .100])
xlabel('Time index n');
ylabel('Amplitude');
title('Unit Step Sequence Delayed');
axis([-10 20 0 1.2]);

Sunday, 24 March 2019

One Month Retrospective on New Zealand


24/3/2019 One Month Retrospective of New Zealand Experience


Today is the 24th of March 2019. Today marks the 1-month Anniversary that I have made landfall in Aotearoa. For the 3rd time in my life I am separated from the nation of my Birth for the duration of at least one Month. The first time being during my childhood in America, the 2nd during my trip to Europe in 2013, and now I begin a 2-year journey on what I hope is the first step towards becoming a Professional Astronomer by completing a two-year Master’s degree under the Institute of Radio Astronomy and Space Research at Auckland University of Technology in New Zealand.

Welcome to Auckland

For the longest time since the heydays of my youth I have been captivated by the stars (I enjoyed Science Fiction immeasurably and I loved watching Science Documentaries especially on space and the Universe) and although it took a few further steps of activation (and a considerable amount of patience in between) before I realized that a life involved in the astrophysical Sciences would be a workable noble goal totally within my reach I have now finally gotten around to applying myself to that cause of becoming a Radio Astronomer. It truly is the most awesome job in the Universe.

'The Institute', playing a vital role in southern sky observations

Since I am now one month (to the day) into that journey to understand the stars, I figure it would be a good time to write a retrospective of some of my experiences.

First of All; Astronomy is everything that I dreamed of and more. It feels so right when we get down to it. It is a wonderful are of study full of incredible phenomenon that defy conventional human understanding of what nature can be. I love it. To study Astronomy is to study nature at its most extreme, its most violent, its most raw. And to put your mind in those places is to open your mind to incredible forces and circumstances that humble your being. What new wonders may we discover further down this path? What new phenomena undreamt of in our age may we blaze the trail for future generations of Astronomers to unlock?

Well that’s why we’re here isn’t it?

We now operate under the tutelage of Dr. Willem van Straten of ‘The Institute’. Dr. Willem’s work revolves around Pulsar Astronomy and Pulsar Timing Arrays for the application of Gravitational Wave Detection (the results of which are still inconclusive but has played an effective role in Galaxy Mapping). Our present mission is to investigate the dispersive effect of the Interstellar Media (ISM) in the propagation of Electromagnetic Radiation (light) through space. The technique we are looking to apply to investigate the ISM is Cyclic Spectroscopy. It is variation of Spectroscopy that when applied to periodic signals can rid of as the DM noise. I can’t complain really, it’s a place to start.

I begin my journey by studying Pulsar Astronomy.

The rest of my studies involve courses in currently involve courses in signal processing, machine learning and computational mathematics and statistics. These are also powerful fields of knowledge that are valuable to the progress of humanity, however they are not Astronomy. They are not my undying passion. So, some of those old sentiments persist. “Why do we need to study this if it’s not going to be directly involved with Astronomy?”

Well, I guess we have to be patient and take the best of whatever comes our way.
All in all, Auckland is a small city such that I have already grown tired of its main thoroughfare called Queen Street. Albert Park was such a disappointment, so I alternate between a few of the city parks. Auckland is not the capital of New Zealand, but it is the most populated city. The Capital is Wellington which I hope to visit soon. As of writing this I have visited Hamilton and Raglan. Hamilton is a small city that lies two hours south by bus from Auckland and is home to the University of Waikato, that is where they developed WEKA, a framework for machine learning and data analysis.


I was told that New Zealand is host to incredible natural landscapes. All of which must be sought after outside of Auckland. I am bounded so far by the North Island. I must break free and see more.


Within 3 weeks of my stay here there was a terrorist attack on a mosque. 50 people died. That was not cool. I guess this is the world we live in now. The great challenge during Carl Sagan's time was nuclear weapons. Now it is the looming shadow of terrorism and ethnic suspicion. It's funny because the night before the attack the motion at the debate club was 'THW suppress the name, race, gender and religion of the perpetrator of a terrorist attack'. Oh the irony. 

Within the first month I have, hiked, played airsoft, visited the local GW, camped, and danced at a festival (hats off to Boom Shangkar). It’s been a great first month. The things that I hope to do during my stay here would be to climb ever higher mountains (Mt. Cook is somewhere on that list), walk through some deep forests, and if I am lucky, learn how to ride a motorbike, and if I am even luckier get a chance to own one (Café racers come to mind). I was told by a wise doctor that I should look to what things may come. Don't look back and don't be held back.


On top of all of that, the craft continues. I wish to learn to write better, be more composed in my thoughts, and learn to be a better speaker, all of which are traits that will help me in Science Communication (my chosen stagecraft). To do that I must read more (science fiction and the great books), practice debate, and be persistent in learning skills that will involve experiences that may be bitter and humbling at the same time. But that is the reality of it. Coming up on the 11th of April will be our first fight. We ride for PATW where we will deliver a 10-minute presentation on Cyclic Spectroscopy and its applications for mankind. The YouTube stories will keep coming out. There are many more stories left to tell.

This is just the beginning.

Sincerely,
Afiq Abdul Hamid


Tuesday, 19 March 2019

Hypothesis Testing the Dark Forest Theory (It's more like a hypothesis really)

I have a really great professor that often swears in class. He's an Englishman so he often takes to saying words like ass and cock. Its not a problem, in fact it is his many quirks that make his teaching enjoyable.

Plus it would make for a really good drinking game. Take a shot for every 'ass' or 'cock'.

He teaches Computational Mathematics and Statistics. His name Robin Hankin and he's a pretty smart cookie. He went to the same school as Sir Isaac Newton.

Full Power Robin. He's about to undergo apotheosis into a being of absolute statistics. Which if you know anything about Statistics means Unity.

He recently went full circle and completed a course section on Hypothesis Testing introducing the concepts of Type I error and Type II error. He introduced the concept of the 'alternative Hypothesis' where we would compare the Null Hypothesis against the Alternative Hypothesis.

Type 1 error: Rejecting the Null given that the Null is true
Type 2 error: Failing to Reject the Null given that the Null is false

He used this example in the case of sentencing a man to jail the case is 'statistically' broken down as follows:

Ho = The Accused man is innocent (By default Innocent until proven guilty)

Ha = The man is guilty (In the weight of the Evidence(p-value))

So he used this example to Explain that if a Type I error occurs that's a case of sentencing innocent man going to jail, and that a Type II error occurs, that's a case of letting a guilty man go Free.

Both are undesirable outcomes. Both are unfortunate occurrences with respect to the justice system.

Here's how we illustrate the Regions that the Errors would Exist in:


Concepts:
**********************************************************

a = the probability of getting a type 1 error
b = probability of getting a type 2 error

power = 1 - b

**********************************************************

So while in class I got to thinking about Alien Civilizations within the context of  Hypothesis testing while also examining the Dark Forest Theory as a solution to Fermi's Paradox. Made popular by Ciu Lixin's novel  'The Dark Forest'. The Dark Forest talks about an emerging interstellar conflict between humans and extraterrestrials called the Trisolarans.


10/10 Amazeballs and would blow your mind


There was a paragraph from the book that had chilled me to the bone the moment I encountered it.

"The universe is a dark forest. Every civilization is an armed hunter stalking through the trees like a ghost, gently pushing aside branches that block the path and trying to tread without sound. Even breathing is done with care. The hunter has to be careful, because everywhere in the forest are stealthy hunters like him. If he finds another life—another hunter, angel, or a demon, a delicate infant to tottering old man, a fairy or demigod—there's only one thing he can do: open fire and eliminate them."

The Dark Forest Theory implies the Universe is filled with hostile civilizations and that communicating our presents in the cosmos would mean suicide.

Now let the Dark Forest be our null Hypothesis:

Ho = The Alien Civilizations are inherently Hostile. Contacting them would be suicide. (Grimdark Universe)

what would an alternative (Ha) to Dark Forest be?

Ha = Alien Civilizations are not Hostile and that there is a vibrant galactic community of civilizations working towards Survival. (Federation of Planets)

so in Hype testing we have something called a p value defined as:

p = The probability given that the null is true of finding and observation or an observation more extreme.

if the the p value falls inside or our of a critical region of significance value (a) that determines whether we reject our null hypothesis or fail to reject our null hype. 

so if the p value were inside the critical region of significance value (a = 0.05) of the Dark Forest Null Hypothesis this would mean we reject an inherently hostile Universe for one that is friendly to communication between civilizations. Referring to our above definition of the Type 1 Error:

Type 1 Error: Rejecting the idea that the Universe is hostile. Basically the probability of encountering a friendly civilization, a culture eager to break bread with us. (more Federation of Planets, less Imperium of Man) in a Universe that is actually hostile.

our Type 2 Error: (failure to reject the Null in a situation it is false) would imply; Encountering a hostile civilization in a Universe that is actually Friendly.

That would be unfortunate wouldn't it. In all that vastness, in all that obscurity. In a universe that is actually friendly towards intelligent life, we discover a civilization that would wipe us out in an instant. In statistics we can do something to reduce the number of type 2 Errors we make. We can collect more data. I guess SETI searches may have a function beyond wasting tax payer money after all.


We come in peace to liberate you from your hubris.

Sincerely
Afiq Abdul Hamid


Monday, 18 March 2019

Revisiting R and R Studio: The Normal/ Gaussian Distribution.


Binomial vs Normal Distribution

The Normal/ Gaussian Distribution is just the Binomial distribution but Extended to very large N (Sample Size), logical probabilities, and it is continuous. That is a key point of Understanding: Binomial Distribution: Discrete Normal/ Gaussian Distribution: Continuous.

An application of the normal/ Gaussian distribution can be found in Noise modelling. Noise is so random, so unpredictable that as a whole we treat it as a distribution of probabilistic values that may appear, centered on the mean.

Sometimes its high, sometimes its low most of the times we don't really know. So we roll the dice.


On some level, this is a Normal Distribution that crackle and hiss through your microphone, emanating from the blue sky beyond your window.

The Normal/ Gaussian Distribution is modeled on a bell curve with 0 being on the left. 1 being on the right. It reads cumulatively from left to right. with the mean being the center. Plugging in different statistics we can shift the mean left or right.

Here are some sample Gaussian distribution bell curve:


Playing with the mean shifts the graph around, playing with the standard deviations makes it compressed or expanded

These are the commands used to generate these graphs, we have to plot first then we can play with points:

> x <- seq(from=-4,to=4,len=100)
> plot(x,dnorm(x),pch=16,ylim=c(0,0.6),type='l',main='some Gaussian distributions')
# Prepare some Gaussian distributions

> points(x, dnorm(x, mean = 1), col = 'red', type = 'l')
> points(x, dnorm(x, mean = 2), col = 'green', type = 'l')
> points(x, dnorm(x, sd = 2), col = 'blue', type = 'l')
> points(x, dnorm(x, mean = -1 , sd = 2), col = 'purple', type = 'l')
> points(x, dnorm(x, mean = -1 , sd = 2), col = 'orange', type = 'l')
> points(x, dnorm(x, mean = -1.5 , sd = 2), col = 'cyan', type = 'l')
> points(x, dnorm(x, mean = -2 , sd = 2), col = 'magenta', type = 'l')
# plot distributions of various shapes and sizes

We can use R to further Explore the Normal Distribution with some simple commands. Lets check them out.

...

we can use pnorm(X) function to key in an X value and find the cumulative area of the graph. The area returned is the cumulative probabilities from the left side of the graph until the keyed in X value.

Example:

pnorm(-1000) = 0 # no probability of happening? 

pnorm(-10) = 7.619853e-24 # fairly low probability of Happening

pnorm(-1.75) = 0.04005916 # low probability of happening

pnorm(0) = 0.5 # Half probability

pnorm(8) = 0.8413447 # fairly high probability of happening

pnorm(1000) = 1 very # High likely probability of happening


...

Normal/ Gaussian Distribution is a key concept in Hypothesis Testing where our objective isn't to test whether to accept a null hypothesis but to determine whether to reject it or fail to reject it.

This will involve something called a p-value...

Sunday, 10 March 2019

10/3/2018 COMP 809/10 Data Mining and Machine Learning  Assignment


Ok I'm going to get a bit ranty to start. I made a move to AUT to do work with IRASR, become a Professional Astronomer, and perhaps one day get a chance to work with the SKA the biggest Radio Telescope Human Beings have ever made.


Inspired by movies like Contact and 2001: A Space Odyssey, this young man decided to offer himself to the alter of the Astrophysical Sciences

I'm not, here to read papers about Data Mining related to the banking sector, loan eligibility assessment, Telecom Trouble Ticketing, ML for Self Driving Cars.

Honestly I thought I had left planet Earth behind already.

Kind of feels like that.
But here I am, doing a Series of Assignments for COMP 809/10 Data Mining and Machine Learning which requires me to read a bunch of papers on DM and ML and extract crucial information about them and put them in a two page report per paper.

Here are the list of Papers:


  1. Coussement, Kristof & Lessmann, Stefan & Verstraeten, Geert. (2016). A comparative analysis of data preparation algorithms for customer churn prediction: A case study in the telecommunication industry. Decision Support Systems. 95. 10.1016/j.dss.2016.11.007.
  2. Gerritsen, R. (1999). Assessing loan risks: a data mining case study.
  3. Mariusz Bojarski, Davide Del Testa, Daniel Dworakowski, Bernhard Firner, Beat Flepp, Prasoon Goyal, Lawrence D. Jackel, Mathew Monfort, Urs Muller, Jiakai Zhang, Xin Zhang, Jake Zhao: “End to End Learning for Self-Driving Cars”, 2016;
  4. M. R. Kraft, K. C. Desouza and I. Androwich, "Data mining in healthcare information systems: case study of a veterans' administration spinal cord injury population," 36th Annual Hawaii International Conference on System Sciences, 2003. Proceedings of the, Big Island, HI, USA, 2003,
  5. Nuno Carneiro, Gonçalo Figueira, Miguel Costa, A data mining based system for credit-card fraud detection in e-tail, Decision Support Systems, Volume 95, 2017, Pages 91-101, ISSN 0167-9236,
  6. Aslıhan Dursun, Meltem Caber, Using data mining techniques for profiling profitable hotel customers: An application of RFM analysis, Tourism Management Perspectives, Volume 18, 2016, Pages 153-160, ISSN 2211-9736,
  7. Y. Temprado, F. J. Molinero, C. Garcia and J. Gomez, "Knowledge Discovery from Trouble Ticketing Reports in a Large Telecommunication Company," 2008 International Conference on Computational Intelligence for Modelling Control & Automation, Vienna, 2008, pp. 37-42.
    doi: 10.1109/CIMCA.2008.116
  8. C. Leon, F. Biscarri, I. Monedero, J. I. Guerrero, J. Biscarri and R. Millan, "Variability and Trend-Based Generalized Rule Induction Model to NTL Detection in Power Companies," in IEEE Transactions on Power Systems, vol. 26, no. 4, pp. 1798-1807, Nov. 2011.
  9. R. M. Gardner, J. Bieker and S. Elwell, "Solving tough semiconductor manufacturing problems using data mining," 2000 IEEE/SEMI Advanced Semiconductor Manufacturing Conference and Workshop. ASMC 2000 (Cat. No.00CH37072), Boston, MA, USA, 2000
I have to choose 3 from among the 9 listed papers. One of which will be article [3] on Self Driving cars and Extract the following information from them to put in a 2 page report.

Background Information: Who was it that was doing the data mining, which organization ie; Google Deep Mind, Nvidia Corporation, or Universite Catholique De Lille etc...

Target Application: What Problem they were trying to solve. Usually this problem comes in the form of situations that human beings face every day such as whether a bank is deciding whether to issue a loan or not, Non Technical Losses in power Generation faced by Power Companies, or Semiconductor Manufacturing in a factory, determining the churn rate for Telecommunications Operators.

These are all situations that are relevant to every day life where data mining and machine learning can make a difference if applied properly. (Well have to read the paper to find out)

Description of the Data Collected: What are the data features/ feature vectors that the papers looked at, The Columns of Data that they collected.

Identification of Algorithm: Decision Tree, k-Nearest Neighbour,  k Mean Clustering, CNN. This is where we describe the machine learning model used. (No details required)

Pre-processing Method: How the data was pre-processed before being fed to the model. Massaging/ cleaning and filling in the blanks. Data Munging is the word. How was the data Munged.

Potential/ Actual Outcome: What was the expected result and what was the actual result. What we expect to see in the model output.

Organizational Benefit: What positive outcome was gained from Data Mining. Here is where we have to go into the nitty gritty details. We have to talk about the accuracy of the results and Potential/ Actual Benefits gained in terms of the $ and Time Saving.

Some critical thinking is involved here because your own reflection on the level of success achieved must be included. Argue the case.  With your knowledge on Data Mining and Machine Learning how could it have been done differently. Would you do it the same or tweak the model in a Certain way to get better results.


Now all we have to do is await the rise of our robotic Overlords

And that's my Assignment. Its not worth much, and there's no hands on exercise in it unlike the subsequent part 2 and unlike my other class ENSE 807 Digital Signal Processing. But it is due in 3 weeks. I have about 2 weeks to pen most of it down.

I'll keep you updated if I find anything interesting.

Sincerely yours,
SofOfTerra92


Tuesday, 5 March 2019

6/3/2019 Finalized subject list... and the software packages needed to do them.

So I think I've finally got together the things that I will be up to during this 12 week semester:

STAT 805 Computational Mathematics and Statistics: R and RStudio to do math
COMP 809 Data Mining and Machine Learning: python/ Anaconda/ Tensorflow for ML model training
ENSE 807 Digital Signal Processing: Matlab & Simulink for Signals Impulse/ Step Analysis

ASTR 800 Advanced Topics in Astrophysics: Is a readings paper, I need to read about the Universe, alot. and write a rather lengthy paper about it by the end of the semester.

STAT 805 Lecture on 6/3/2019

STAT 805 class today. We moved to Chapter 2 (normal distribution/ Gaussian) from Chapter 1 (binomial distribution)

Binomial Distribution

As the name implies its a 'two number' distribution. Two numbers meaning that the result of the experiment that conduct is either one case or the other, success or fail, heads or tail ,dark or light, day or night, good or evil, Batman or Superman.

note: this can be extended to continuous values as well. Like age (age >= 13 || age < 13) or weight (weight > 67.5 Kg || weight <= 67.5 kg). Treating it as a critical value. Then we can conduct a 'binomial trial' on a sample of n people with these critical value characteristics.

In a binomial trial of n repeated bouts in a multiverse (where the outcome of 1 Universe does not affect the other) with p being the probability of Batman coming out victorious is a success (my own Bias).


  • The Experiment consists of 'n' number of repeated Trials - They fight in 'n' number of Universes.

  • Each trial can result in only one of two possible outcomes - Either batman wins or Superman wins.

  • The probability of a success case is constant - In every Universe batman has the same probability of winning (p=0.5).

  • The trials are independent of each other - A batman win in one Universe does not affect the batman win in another Universe. (and in none of the Universe are both their moms named Martha. I think they both lose in that one)

There's no way to ace Computational Mathematics without actually getting down and dirty and playing with some RStudio. So lets get down to it and start simulating some non-Interdimensional Hero Bouts shall we?

Lets take the function: rbinom(20,5,0.5)

which tells us, if we sample 20 Universes (vector quantile), each Universe they fight (3 times) and in each Universe Batman (p = success) has a 0.5 percent chance in winning. Yields us:

[1] 2 3 3 1 4 3 2 5 3 0 3 4 2 4 3 2 3 2 2 1

[1] 3 4 1 2 4 3 1 3 0 3 1 2 2 1 0 2 3 2 3 1

[1] 2 2 3 2 1 3 3 3 2 3 2 3 1 4 2 4 4 2 1 5

Each of these numbers represents the 'n' number of Batman wins in each Universe. If we switch to n trials = 1, we get something that looks like Binary: rbinom(20,1,0.5)

[1] 1 0 1 1 0 1 0 0 1 1 0 0 1 0 0 0 0 1 0 0

[2]  1 1 1 1 0 0 1 0 1 1 1 0 0 0 0 0 1 0 1 1

[3] 1 0 0 1 0 0 0 0 0 1 0 0 1 1 0 0 0 0 1 1


Think of vector quantiles as your samples. Number of samples. Number of Universes or Number of kids asked to toss a coin.


Diaries of an Aspiring Astrophysicist (DAS Astro) Podcast

Diaries of an Aspiring Astrophysicist Episode 1: The last year has been weird Episode 2: Cosmic Collisions and Gravitational Wa...